
Health Signals. Cost Solutions.
Your plan is already funding metabolic risk it cannot see.
In a self-funded plan, the employer carries the claim. Metabolic disease develops for years before it produces a diagnosis code, so the exposure sits in your population well before it appears in your claims file.
Gluva measures that exposure in a defined employee cohort and reports the change back to the plan sponsor. That gives you health metrics you can track year over year. This allows you to see where risk is concentrated, aim wellness and benefit dollars at the part of the population were it is most needed for the highest ROI. This can potentially hold down the claims, pharmacy, and stop-loss costs that follow untreated metabolic risk.
What sits on the plan
8 in 10 US adults with prediabetes who are unaware of it
— CDC
2.6x: Medical spending for an employee with diabetes compared to one without
6% to 14%
Annual premium increase from broader GLP-1 coverage, per EBRI modeling
58% Reduction in progression to type 2 diabetes with lifestyle intervention
Four exposures a finance leader owns directly.
Claims you cannot forecast
Actuarial projections are built on diagnosed conditions. A population carrying substantial undiagnosed metabolic risk will underperform its own projection, and the variance shows up as a budget miss you had no way to price.
Specialty pharmacy demand
GLP-1 utilization is the fastest-moving line in most self-funded pharmacy budgets source. The population driving that demand is largely the same population carrying undiagnosed metabolic risk.
The population driving that demand is largely the same population carrying undiagnosed metabolic risk. Identified early, that risk becomes something a plan can manage rather than absorb.
Stop-loss renewal
Specific and aggregate pricing follows your claims experience. A rising chronic-condition trend prices into your renewal for years after the underlying shift occurred, and carriers assess the trajectory as much as the current number.
Spend you cannot defend
Most wellness programs report participation. Participation is an activity measure, not an outcome, and it will not answer a board or an auditor asking whether plan dollars were spent prudently.
Plan sponsors face growing expectation to document that vendor spending produced something. A program that reports measured change gives you a defensible answer.
How the program runs.
Voluntary from end to end. The employer receives group-level reporting only, and never sees an individual employee’s data.
1
Every eligible employee is offered a sensor
Participation is entirely voluntary. Employees opt in through your benefits channel, and anyone who enrolls receives an over-the-counter continuous glucose monitor at no cost to them.
Eligibility is set with you during plan design, so the offer matches your population and your benefit structure.
2
Two-week measurement
Each participant wears the sensor for two weeks while it collects their glucose response data. That produces a continuous record of how their body responds to their own diet and routine, rather than the single fasting snapshot an annual physical provides.
Participants see their own readings in real time throughout the cycle.
3
Coaching goes where it is needed
After the two-week period, results are reviewed. Participants whose readings sit within typical ranges are done — no second round is needed, and the program does not manufacture one for them.
After tge two-week oerduim, participants with readings outside typical ranges are offered a consultation with a licensed registered dietitian. This is a scheduling rule for allocating coaching time, not a clinical finding, and no one is told they have a condition.
4
Registered dietitian consultation
A licensed registered dietitian reviews the readings with the participant and delivers structured nutrition and lifestyle education built around what their own data actually showed — not a generic handout.
5
Second measurement
Participants who completed a consultation wear the sensor for a second two-week round using the guidance from the dietician.
The comparison between the two wear periods is the outcome the program reports in the employer dashboard.
6
Education continues through the year
Enrolled employees keep receiving practical nutrition and lifestyle material on holding their numbers in range, delivered on a regular schedule, so the program does not go quiet between cycles.
The plan sponsor receives de-identified, aggregated cohort reporting sized for the population, in a format a broker, actuary, or consultant can use directly.
What the sensor actually measures.
An annual physical gives you one fasting number from one morning. Two weeks of continuous readings give you four things that number cannot show.
Level
Average glucose
Where a participant’s glucose sits across two weeks of ordinary life, including the meals, stress, and sleep an annual fasting draw never sees.
Consistency
Time in range
How much of the day is spent within a typical range. This is the measure most responsive to what someone eats and when, which makes it the one that moves with coaching.
Stability
Variability
The size of the swings between highs and lows. Two people can share an identical average and have completely different days underneath it.
Population
Cohort distribution
How the enrolled group spreads across response bands. This is the number that sizes your exposure and tells you where a dollar of benefit spend does the most work.
What you see as the plan sponsor.
Group-level only, aggregated and de-identified, with cohort minimums applied so no individual can be identified from any report.
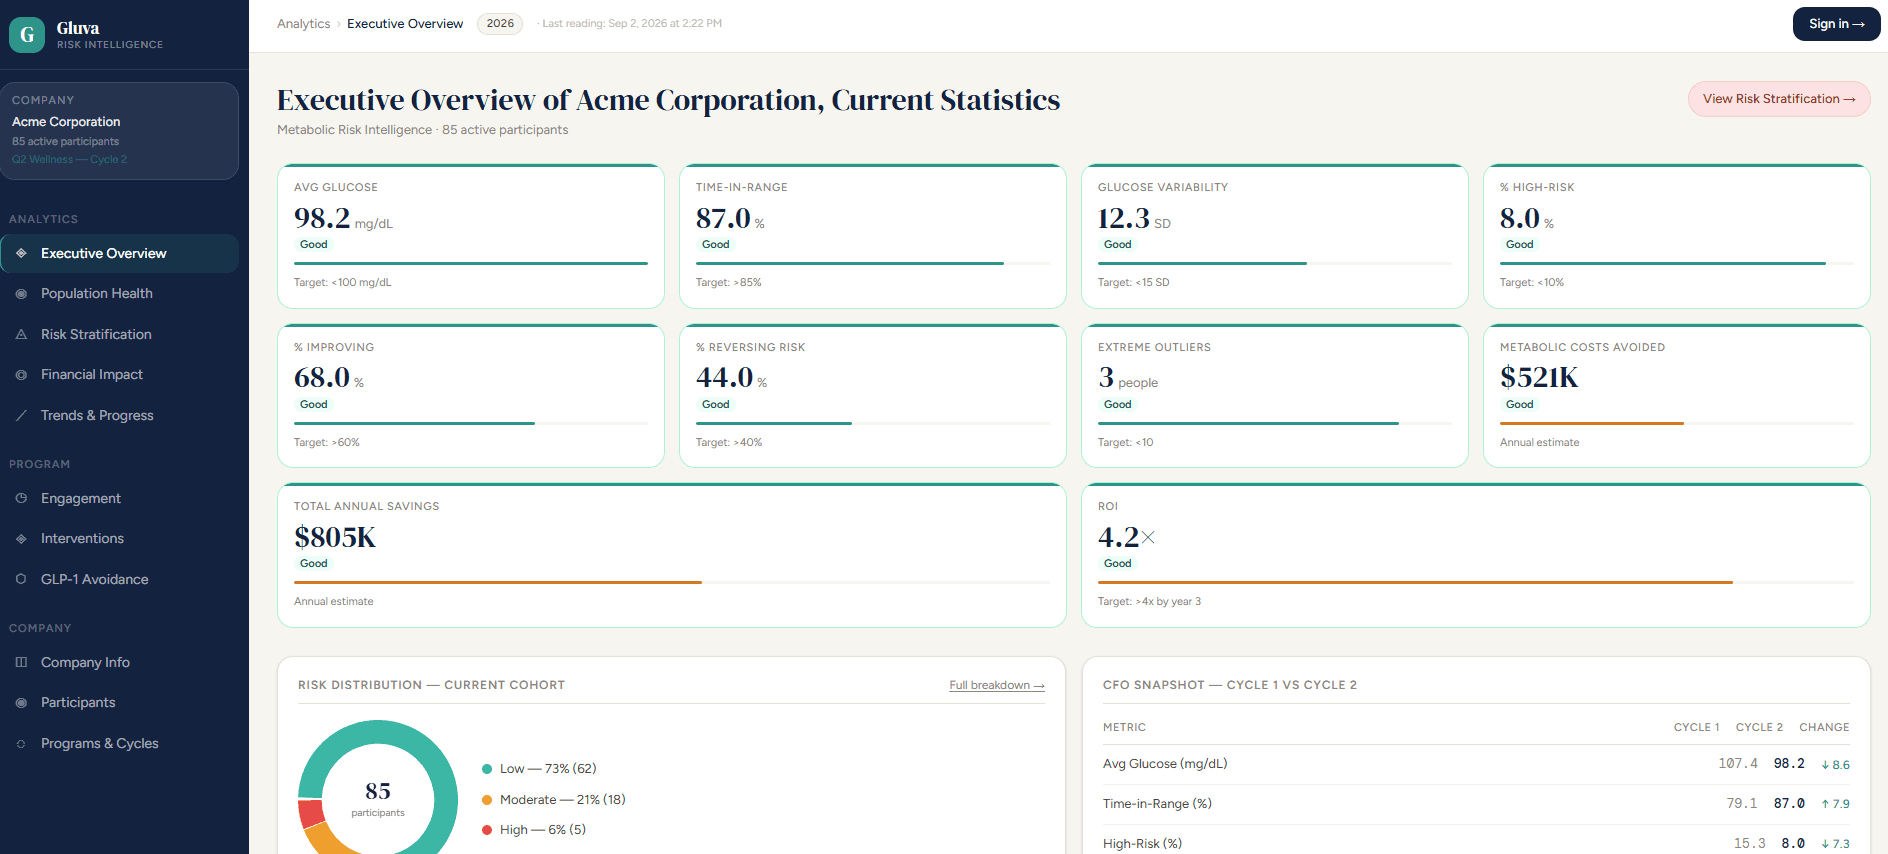
The same view drills into population health, risk stratification, engagement, and cohort trend over time. Everything the employer sees is aggregated; nothing in the sponsor view identifies a person.
What change looks like for one participant.
Your HR team never sees this view. The participant does, and so does their dietitian.
Average 24-hour glucose profile, first cycle versus second
De-identified participant example · 9,466 readings at five-minute intervals · 15-minute bins
The two curves keep the same shape — the same overnight floor, the same climb through the morning, the same evening plateau — but the second cycle runs about 6 to 9 mg/dL beneath the first for nearly the whole day. A whole-curve shift like that points to a change in baseline conditions rather than one meal being fixed.
Average glucose
105.9→99.3
↓ 6.6 mg/dL
Overnight average, midnight to 6am
100.1→91.8
↓ 8.3 mg/dL
Time above 140 mg/dL
2.49→1.14
↓ more than halved
Median daily peak
151→137
↓ 14 mg/dL
Excursions above 140 per day
1.00→0.55
↓ 0.45 per day
Time in tight range, 70–140
97.4→98.4
↑ 1.0 percentage point
Cycle 1 — where the glucose sat
70–140 mg/dL97.4%
140–1802.2%
Above 1800.3%
Cycle 2 — after the dietitian consultation
70–140 mg/dL98.4%
140–1801.0%
Above 1800.1%
What your HR team will never see.
The fastest way to lose employee trust in a health program is ambiguity about who sees the data. So here it is without ambiguity.
The employer never receives
- Any individual employee’s glucose readings
- Names, or any result that can be traced to a person
- Who enrolled and who declined, by name
- Who was offered a dietitian consultation
- Any list of individuals for follow-up of any kind
The employer always receives
- Cohort-level distributions and averages
- Change between measurement cycles across the group
- Completion rates, stated openly rather than folded into the result
- Reporting only above a minimum cohort size, so small groups cannot be reverse-identified
- A format your broker or actuary can use without translation
Questions a CFO asks first.
Is this a diagnostic or clinical program?
No. Gluva is an educational and wellness program. The sensor is an over-the-counter consumer device used to give participants information about their own glucose response, not to diagnose anything. Registered dietitians provide nutrition and lifestyle education. No diagnosis is made, no treatment is prescribed, and nothing here substitutes for a participant’s own physician.
How is this different from the wellness vendor we already pay?
Most wellness contracts report participation including how many people signed up, logged in, or attended. Gluva reports a measured physiological change between two wear periods on the same people.
Does this replace a GLP-1 coverage decision?
No.. What it does is size the population driving that demand, so you set coverage policy against a number from your own group rather than a national average.
Find out what a measured cohort would show in your population.
Request a plan review
We reply to every enquiry from a plan sponsor, broker or consultant.